
There's not much to complain about here. The offense has struggled lately, but it was the catalyst of the great start in 2006. The 2005 Sox offense failed to produce runs in many ballgames. Of course they managed to win a fair share of those games anyways. Here's a look at the team winning percentage by runs scored:
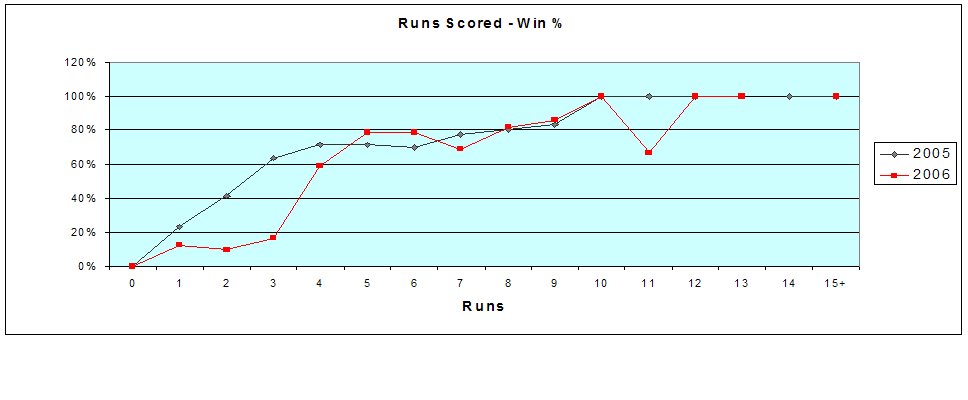
As my two year old daughter would say, "Wowser!" This year's Sox team just can't grind out victories. Last year the Sox won 22 games when they scored 3 runs or less and 57 games when they scored 5 runs or less. Through 138 games this year, those numbers are 5 and 29, respectively.
Some of this is luck, but 95% of it is bad pitching. Let's take a look at the runs allowed distributions:
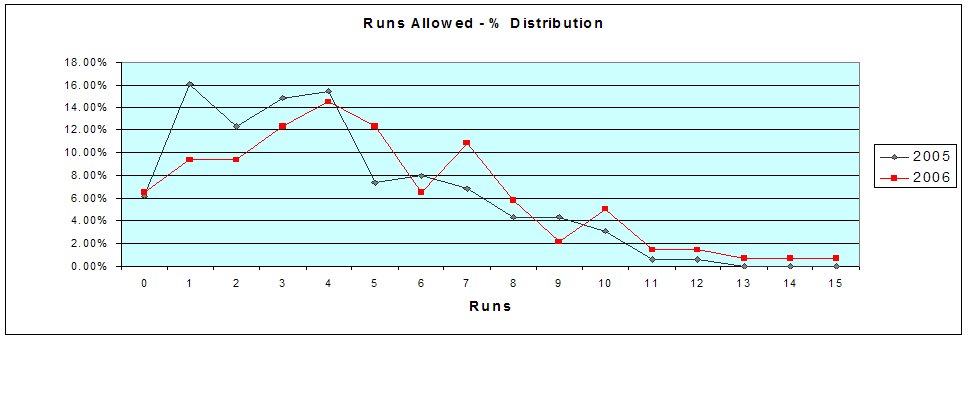
You can see why the Sox won so many of those low scoring games last year. The pitching staff yielded 3 runs or less in 49.38% of their games last year compared to 37.68% so far in 2006. As for the high scoring games, the Sox gave up 7 or more runs in 32 games last year. This year that number is 41 and counting.
There's not much to learn from the runs allowed win percentage chart as the distribution of runs allowed above tells pretty much the whole story. But since I ran the numbers, here is the chart:

Tonight's game against Boston was the first time the Sox were shutout 1-0 this year. They are now 12-1 when they give up only one run after going 25-1 last year.