It's actually quite ironic that people who pride themselves on taking a scientific view of the game would describe something that they aren't able explain as "luck". That may be a bit unfair, as the majority of bloggers realize that while luck plays a part, other factors, such as managerial decisions and run distribution, also play an important role. But too many times people write-off the variance between a team's actual record and pythagorean record as luck without making any effort to look for other possible explanations.
Pythagorean won/loss records are certainly a great, if blunt, tool in evaluating baseball teams. Anyone who looked at the NL East standings at the 2005 All-Star break would have realized that the Washington Nationals were going to have a difficult time staying in first place. While they were 16 games over 500 they had allowed more runs than they had scored, 361 to 357. No amount of managerial skill or run distribution could explain a difference that large and luck (along with a solid closer) certainly played a major role in their first half success.
Of course, the other surprise team in baseball at the break was the White Sox, and while they were already outplaying their pythagoreanan record by 7 games, they still had the best pythagorean winning percentage (.587)in the American League at the break.
This was actually a nice change a pace for the Sox as they had fallen short of thier pythagorean projections for the previous three seasons. And of course I couldn't help but wonder if the change was due to Kenny Williams offseason emphasis on smallball and defense. To do this I wanted to take a closer look at their run distribution in 2005 compared the 2004 White Sox squad.
The Same, But Different
Before I begin, I guess I should state what I define as "smallball". On offense, I would simply define it as sacrificing outs for runs. This will reduce your chance of a big inning but increase your chance of scoring at least one run. So yes, the Sox still played "longball" and hit 200 home runs for the sixth straight year. But they also employed a strategy of bunting, stealing, and moving runners over that emphasized getting one run across the plate.
Over at Beyond the Boxscore, Cyril Morong recently did his own comparison between the offense in 2005 and 2004, but came away unimpressed with the changes that were made. While I think he does a great job of presenting the facts, I don't think he came up with the right conclusions.
There's no denying the fact that the 2005 White Sox scored 124 less runs than the 2004 version and this certainly wasn't what Kenny Williams had in mind as he changed the team in the offseason. Unfortunately for Williams, players such as Uribe, Crede, Rowand and Pierzynski, did not have the offensive years that were expected of them.
Morong then looks at run distribution to see if the 2005 version was better than the 2004 version at avoiding low scoring games, and he says no, they weren't any better. They actually played the same amount of low scoring games. Both teams played 81 games where they scored 4 runs or less and 81 games where they scored 5 runs or more.
While Morong sees this information as evidence that the Sox weren't able to build a more consistent offense, I can't help but find it remarkable. Do you mean to tell me that the Sox offense sacrificed 124 runs in the offseason and still managed to score at least 5 runs in a game as many times as the 2004 team? That's quite amazing. And when you add in the fact that American League teams scored less runs overall in 2005 (4.74 per game compared to 5.01) you can emphatically say yes, the 2005 White Sox did do a better job of avoiding the low scoring game.
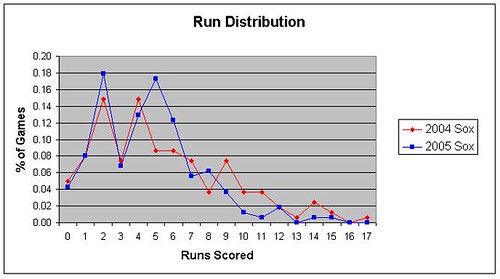
As you can see from the distribution chart, the 2004 White Sox did not have an offensive advantage over the 2005 team until you get to 9 runs scored. The 2004 team just happened to score double digits in a ridiculous amount of games. That had the effect of driving up their pythagorean winning percentage but did little to add actual wins. A team will win over 80% of the games they play when they score at least 7 runs. So it doesn't make much of a difference in the win column whether the offense scores 10 runs or 15 runs in one particular game. The bottom line is that those 124 extra runs that were scored by the 2004 team did not help the Sox win many more ballgames.
In 2005, the Sox were basically able to upgrade defensively at left, shortstop, and rightfield without really giving up much, if anything, in offense. Indeed, if a few more players had lived up to their offensive expectations, the Sox very well may have pulled off an impressive feat of improving their offense while scoring less runs. All hail Kenny Williams.
In Parts II and III, I plan on comparing the 2005 White Sox runs scored and a runs allowed distributions to those of the Cleveland Indians. The Indians finished with the best pythagorean record in the AL (5 games ahead of the Sox) yet finished 6 games behind the Sox in the standings. I'm hoping the distributions will shed a little bit of light on how this result occured.
UPDATE:
In response to a comment below, I thought it would be a good idea to try and quantify the difference in the offense.
First, you can get an expected number of wins by an offense by comparing their run distribution to the league average winning percentage at each run scoring level. For example, in 2005, a team that scored 5 runs won 61.7% of their games. If you go through the run distribution for the 2005 Sox (and I do this in upcoming posts) their offense should have produced 80.4 wins when combined with league average pitching. If you plugged the 2004 Sox into the same distribution chart, they would have been expected to win 87 games.
However, more runs were scored in 2004 and the winning percentage for each distribution level would be lower. Therefore the 2004 Sox expected offensive win total would drop to 85 or 86. You would need the winning percentages for each scoring level in 2004 to get the exact number and I don't have those readily available. However, I think the above exercise gets close enough to the truth of the matter which is that 2004 offense was better, but not as much as the runs scored gap suggests.