Actual Records
| Team | W | L | GB |
| Sox | 99 | 63 | - |
| CLE | 93 | 69 | 6 |
Pythagorean Records
| Team | RS | RA | W | L | GB |
| CLE | 790 | 642 | 96 | 66 | - |
| Sox | 741 | 645 | 91 | 71 | 5 |
I've found that run distribution is part of the reason for this discrepancy. As you can see, runs scored accounted for the biggest difference in the pythagorean standings as the two teams gave up an almost identical amount of runs. The Cleveland offense, however, scored 49 more runs, and isolating this component adds 4.55 wins to their pythagorean record.
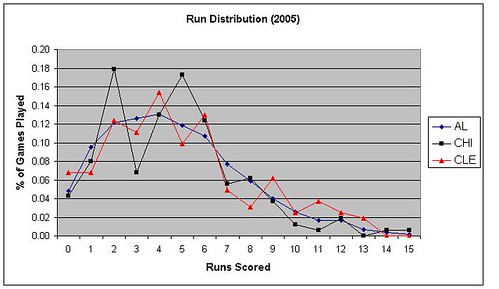
There is nothing that looks extraordinary in this graph. Both teams played a similar amount of games where the offense scored 4 runs or less. Cleveland actually had more of these games, 85 to Chicago's 81. Neither team differed that much from the AL average in these games. Still, it's surprising Cleveland wasn’t able to score runs on a more consistent basis.
On the flip side, you can also see how many high scoring games the Cleveland offense achieved. They had 27 games of at least 9 runs scored compared to only 20 for the Sox.
As we saw in Part I, concentrating runs in a bunch of high scoring games is not an optimal distribution pattern. They do add to your winning percentage, but each run scored is worth marginally less as your run total increases. For example, going from three runs scored to six runs scored last year would have more than doubled your expected winning percentage from .340 to .691, a difference of .351. Going from six runs scored to nine brought you to .846, only a difference of .155.
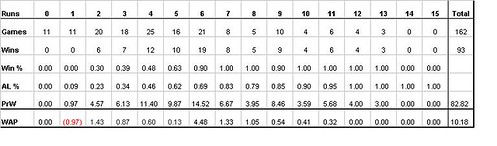
Predicted Wins
The chart below gives the distribution of runs scored for the Sox and Indians last year as well as the average winning percentages for AL teams at each run level. From these numbers, you can calculate the amount of Predicted Wins (prW) each offense would have if they received league average pitching.
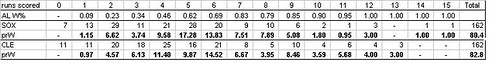
As you can see, the Sox offense racks up 80.4 wins while Cleveland comes in 82.8, a difference of 2.4 games. This is 2.1 games less than the 4.5 game difference derived from the pythagorean record.
There is one huge caveat when looking at the offense in this manner: they are not including park effects! As we know, the Cell is a hitter's park, and the Jake has become a pitcher's park. This means that a run in the Jake is worth more in terms of winning percentage than a run in the Cell. And it also means the 2.4 prW gap may actually be something closer to the 4.5 pythagorean difference when park effects are included. Of course, the same will be true for runs allowed when we take a look at pitching and defense in Part III.
Actual Winning Percentage
So Predicted Wins doesn’t get us too far when we factor in park effects. That’s fine as I think each teams actual win percentages are much more interesting. Unfortunately, I’m not quite sure what, if any, conclusions to draw from them.
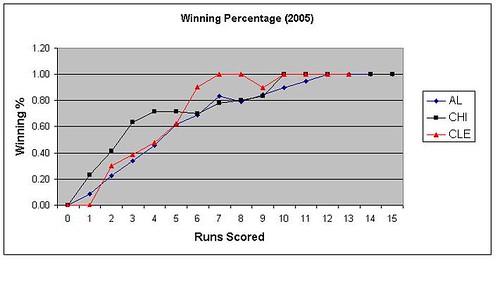
The Sox were much better than league average in low and medium scoring games while Cleveland beat the league average in high scoring games.
| runs | CHI | CLE | W+- |
| 0-2 | 15-34 | 6-36 | +9 |
| 3-5 | 42-18 | 29-30 | +13 |
| 6+ | 42-11 | 58-3 | -16 |
The table above breaks down these games into the three categories. The odd thing about this breakdown is that both pitching staffs gave up nearly the same amount of runs but with very different results. The Cleveland staff actually gave up less runs than the Sox so there is no obvious reason why they would do worse in low scoring games.
The two tables below calculate a number called WAP (Wins Above Predicted). This number shows how many wins each team recorded above the prW number previously calculated.
Sox WAP
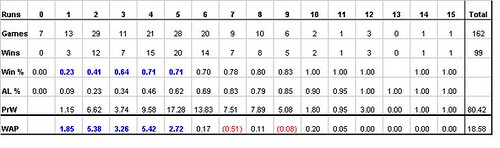
The Sox has an unbelievable record in games where they scored 5 runs or less. They went 57-42 for a winning percentage of .523. The league average winning percentage for these games would have been .350 and only 38 wins. The Sox WAP of 18.6 comes almost entirely from games where the Sox scored 5 runs or less.
I'm almost suprised that the Sox didn't figure out a way to win a game in which the offense scored no runs at all. They were able to attain a winning record by just scoring three runs while the average AL teams had to score five. They even had a not to shabby winning percenetage of .410 in games where they scored two runs.
I would have to attribute this to dominant pitching, superior game strategy, and a good amount of luck. There is just no way you can expect to produce so many wins in these games without some luck on your side unless you have five Johan Santanas taking the mound for you. The Sox may have had the best rotation in baseball, but they weren’t that dominant.
Cleveland WAP
The Indians don't exactly do badly in low scoring games, as they come in just above league average. Going back to those 85 games of 4 runs or less scored by the Indians, they were actually about 2 games better than league average at 25-60. But that record is less than stellar when compared to the Sox, who played four less games at that level, but finished with 12 more wins at 37-44.
At the high end, Cleveland was absolutely dominant in games when they scored at least six runs. They were 58-3 for winning percentage of .951. League average for these games would have been 50-11 for an .820 winning percentage. The Sox finished these games at 42-11, approximately league average.
I have some theories on how these results occured, but I plan on holding off trying to explain them until after I look at the runs allowed distribution in Part III.