Part I
Part II
Cleveland led the league in preventing runs from scoring whole the Sox finished right behind them. The Tribe only let 642 runs cross the plate, three less runs than the Sox. But looking at Predicted Wins derived from league run distribution percentages show that the Sox pitching staff actually had a better year.
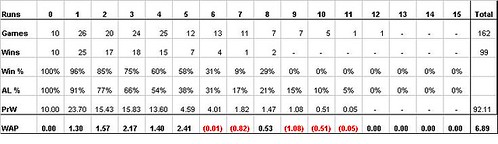
Sox Predicted Wins and WAP
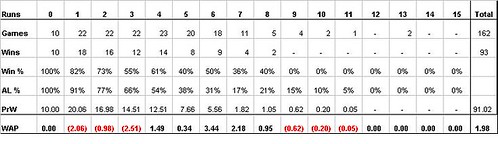
Cleveland Predicted Wins and WAP
The White Sox pitching staff had 105 games in which gave up only 4 runs or less compared to 99 for the Indians. These games are the most crucial for a pitching staff as they give the team a greater than 50% chance of winning the game. The graph below shows how the Sox had a higher percentage of these low scoring games than the Tribe and the rest of the league.
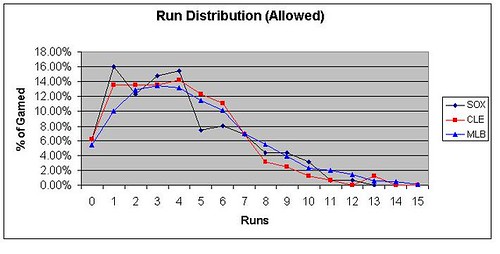
The graph also shows that Cleveland was able to prevent more runs in total than the Sox by concentrating their games in the 4-6 runs allowed range while reducing the amount of very high scoring games. However, while this distribution pattern allowed the Tribe to give up less runs it did not help them win more ballgames. With a league average offense, Cleveland would have been expected to win 91.02 games. That's very good, but a full game less than the Sox who would have been expected to win 92.11 games with a league average offense (which is about what they had).
The White Sox pitching staff is even more impressive when you consider they pitched in the homer happy environment of U.S. Cellular field. Adjusting for park factors could easily boost their predicted win total to 95 games
Actual Win Percentage
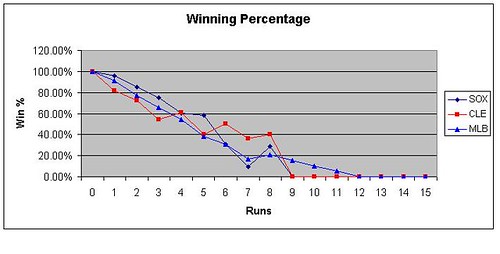
It's again interesting to look at each team's actual win percentage in these games. For some reason Cleveland just wasn't able to do well in low scoring games despite a top pitching staff and above average offense. The chart below shows how Cleveland trailed both the White Sox and the rest of the AL in winning low scoring games.
WAP
Since Cleveland had the better offense, you would expect that they would have more wins above their pitching staffs predicted level (WAP) than the White Sox. But Cleveland only won 2 more games than predicted while the White Sox won 6.89 more games.
Conclusions
I started this project hoping to find that the Sox were actually better than their Pythagorean record suggested. However, the numbers don't really lead to that conclusion. The Sox offense was good enough to produce 80 wins while pitching and defense came in at 92 wins. You add these two numbers up (1 game below, 11 game above) and you get their Pythagorean win total of 91 games. It actually works out quite nicely.
But the numbers do show that Cleveland was not as good as their Pythagorean record would indicate. Their offense was only slightly better than average at 82.8 games while their pitching came in below the Sox at 91. Viewing runs scored through a distribution scheme instead of total runs scored still puts Cleveland ahead of the Sox, but not by the 5 games predicted by the Pythagorean formula.
Nevertheless, this little project doesn't get us much closer to explaining how the Sox finished six games ahead of the Tribe last year. Maybe it was because the Indians were inconsistent, as they were outscored in both April and July. Maybe they just didn't match up with the Sox as they dropped 14 of 19 games against them. Maybe they were just chokers as they went 22-36 in one run games and crapped their pants the last week of the season.
Who knows. But as I finish this look back at last year let me make a statement about this year. The Sox got better and the Indians got worse. If the Tribe couldn't get the job done in 2005, what chance do they have in 2006?